


Geneva. 06 September 2023. The International Air Transport Association (IATA) released data for July 2023 global air cargo markets, showing a continuing trend of recovering growth rates since February. July air cargo demand was tracking just 0.8% below the previous year’s levels. Although demand is now basically flat compared to 2022, this is an improvement on recent months’ performance that is particularly significant given declines in global trade volumes and rising concerns over China’s economy.
Global demand, measured in cargo tonne-kilometers (CTKs*), tracked at 0.8% below July 2022 levels (-0.4% for international operations). This was a significant improvement over the previous month’s performance (-3.4%).
Capacity, measured in available cargo tonne-kilometers (ACTKs), was up 11.2% compared to July 2022 (8% for international operations). The strong uptick in ACTKs reflects the growth in belly capacity (29.3% year-on-year) due to the summer season.
Several factors in the operating environment should be noted:
In July, both the manufacturing output Purchasing Managers Index or PMI (49.0) and new export orders PMI (46.4) were below the critical threshold represented by the 50 mark, indicating a decline in global manufacturing production and exports.
Global cross-border trade contracted for the third month in a row in June, decreasing 2.5% year-over-year, reflecting the cooling demand environment and challenging macroeconomic conditions. The difference between the annual growth rates of air cargo and the global goods trade narrowed to -0.8 percentage points in June. While air cargo growth is still lagging world trade, the gap is the narrowest since January 2022.
In July, the global supplier delivery time PMI was 51.9, signaling fewer supply chain delays. All major economies, except China, had PMIs above 50. The U.S., Europe, and Japan recorded PMIs of 54.2, 57.7, and 50.4, respectively.
Inflation saw a mixed picture in July, with the increase in US consumer prices picking up pace for the first time in 13 months. Meanwhile, in China, both consumer and producer prices fell, pointing to a possible deflationary economy.
“Compared to July 2022, demand for air cargo was basically flat. Considering we were 3.4% below 2022 levels in June, that’s a significant improvement. And it continues a trend of strengthening demand that began in February. How this trend will evolve in the coming months will be something to watch carefully. Many fundamental drivers of air cargo demand, such as trade volumes and export orders, remain weak or are deteriorating. And there are growing concerns over how China’s economy is developing. At the same time, we are seeing shorter delivery times, which is normally a sign of increasing economic activity. Amid these mixed signals, strengthening demand gives us good reason to be cautiously optimistic,” said Willie Walsh, IATA’s Director General.
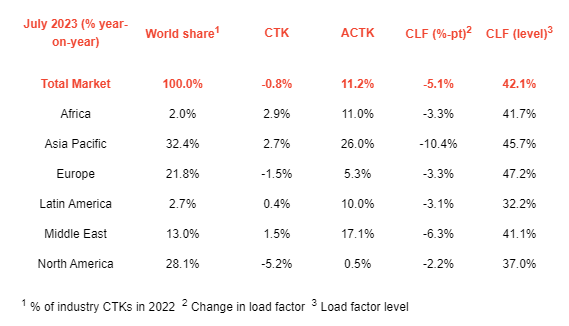
022 2 Change in load factor 3 Load factor level
July Regional Performance
Asia-Pacific airlines saw their air cargo volumes increase by 2.7% in July 2023 compared to the same month in 2022. This was a significant improvement in performance compared to June (-3.3%). Carriers in the region benefited from growth on three major trade lanes: Europe-Asia (3.2% year-on-year growth), Middle East-Asia (up from 1.8% in June to 6.6% in July), and Africa-Asia (returning to double-digit growth of 10.3% year-on-year from -4.8% in June). Additionally, the within-Asia trade lane also performed considerably better in July, with an annual decline of international CTKs at 7.5% compared with the double-digit decreases observed since September 2022. Available capacity in the region increased by 26.0% compared to July 2022 as more belly capacity came online from the passenger side of the business.
North American carriers posted the weakest performance of all regions, with a 5.2% decrease in cargo volumes in July 2023 compared to the same month in 2022, marking the fifth consecutive month in which the region had the weakest performance. It was, however, a slight improvement compared to June (-5.9%). The transatlantic route between North America and Europe saw traffic declining by 4.3% in July, 1.2 percentage points worse than the previous month. Capacity increased 0.5% compared to July 2022.
European carriers saw their air cargo volumes decline by 1.5% in July compared to the same month in 2022. This was, however, an improvement in performance versus June (-3.2%). Volumes were affected due to the aforementioned Europe–North America performance and contractions in the Middle East-Europe (-1.2%) and the within-Europe (-5.1%) markets. Capacity increased 5.3% in July 2023 compared to July 2022.
Middle Eastern carriers experienced a 1.5% year-on-year increase in cargo volumes in July 2023. This was also an improvement to the previous month’s performance (0.6%). The demand on Middle East–Asia routes has been trending upward in the past two months. Capacity increased 17.1% compared to July 2022.
Latin American carriers posted a 0.4% increase in cargo volumes compared to July 2022. This was a drop in performance compared to the previous month (2.2%). Capacity in July was up 10.0% compared to the same month in 2022.
African airlines had the strongest performance in July 2023, with a 2.9% increase in cargo volumes compared to July 2022. Notably, Africa–Asia routes experienced significant cargo demand growth (10.3%). Capacity was 11.0% above July 2022 levels.
- Asia-Pacific airlines saw their air cargo volumes increase by 2.7% in July 2023 compared to the same month in 2022. This was a significant improvement in performance compared to June (-3.3%). Carriers in the region benefited from growth on three major trade lanes: Europe-Asia (3.2% year-on-year growth), Middle East-Asia (up from 1.8% in June to 6.6% in July), and Africa-Asia (returning to double-digit growth of 10.3% year-on-year from -4.8% in June). Additionally, the within-Asia trade lane also performed considerably better in July, with an annual decline of international CTKs at 7.5% compared with the double-digit decreases observed since September 2022. Available capacity in the region increased by 26.0% compared to July 2022 as more belly capacity came online from the passenger side of the business.
- North American carriers posted the weakest performance of all regions, with a 5.2% decrease in cargo volumes in July 2023 compared to the same month in 2022, marking the fifth consecutive month in which the region had the weakest performance. It was, however, a slight improvement compared to June (-5.9%). The transatlantic route between North America and Europe saw traffic declining by 4.3% in July, 1.2 percentage points worse than the previous month. Capacity increased 0.5% compared to July 2022.
- European carriers saw their air cargo volumes decline by 1.5% in July compared to the same month in 2022. This was, however, an improvement in performance versus June (-3.2%). Volumes were affected due to the aforementioned Europe–North America performance and contractions in the Middle East-Europe (-1.2%) and the within-Europe (-5.1%) markets. Capacity increased 5.3% in July 2023 compared to July 2022.
- Middle Eastern carriers experienced a 1.5% year-on-year increase in cargo volumes in July 2023. This was also an improvement to the previous month’s performance (0.6%). The demand on Middle East–Asia routes has been trending upward in the past two months. Capacity increased 17.1% compared to July 2022.
- Latin American carriers posted a 0.4% increase in cargo volumes compared to July 2022. This was a drop in performance compared to the previous month (2.2%). Capacity in July was up 10.0% compared to the same month in 2022.
- African airlines had the strongest performance in July 2023, with a 2.9% increase in cargo volumes compared to July 2022. Notably, Africa–Asia routes experienced significant cargo demand growth (10.3%). Capacity was 11.0% above July 2022 levels.