


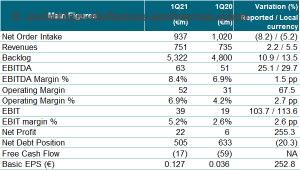
- All the income statement items have grown in 1Q21 vs 1Q20.
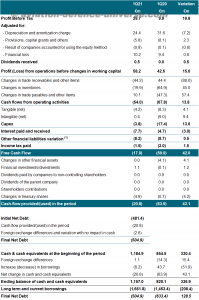
- Net Debt reached €505m vs €633m in March 2020. Net Debt / EBITDA LTM ratio stood at 2.4x in March 2021 vs 2.2x in March 2020.
- Backlog reached another new historic absolute high (€5,322m), implying 1.74x backlog/revenues LTM.
Madrid. 27 April 2021. Fernando Abril-Martorell, Chairman and Chief Executive Officer of Indra: “The results of the first quarter of 2021 are outstanding as they already show the recovery of the activity levels prior to the pandemic, while they reflect an improvement of margins thanks to the costs containment. Minsait 1Q21 revenues already exceed those of 1Q19, while Transport & Defence were almost equal, even though significant delays continue to occur due to the mobility restrictions that remain in force.
All the income statement items have grown in 1Q21 vs 1Q20, with a clear improvement in profitability that ends up being reflected in net profit, more than 3 times higher than in 1Q20 and 1.2 times higher than in 1Q19. For its part, cash generation in the quarter is €42m better than in 1Q20.
For another quarter, the backlog continues its double-digit growth and once again reaches new highs in Indra’s history.
In short, the results of the first quarter are in line with our 2021 objectives and reinforce our ambition to recover the pre-crisis levels of 2019 this year, despite the fact that the pandemic is not overcome yet and continues to cause uncertainty and complexity for the management of the business.”
Backlog reached again its highest historical level and stood at €5,322m in 1Q21, implying +10.9% growth in reported terms. Transport & Defence backlog amounted to €3.6bn and increased by +17.6% in 1Q21 vs 1Q20, standing out Defence & Security, which amounted to €2.2bn. For its part, Minsait backlog slightly decreased -0.9% in 1Q21 (affected by FX in -6pp) and totaled €1.7bn. Backlog/Revenues LTM also reached a new historic high and stood at 1.74x vs 1.50x in 1Q20.
Order intake in 1Q21 registered -5.2% decrease in local currency:
- 1Q21 Order intake in T&D up +3.5% in local currency, driven by the strong activity registered in Defence & Security (+27.7% in local currency), mainly due to the higher order intake in the Eurofighter project.
- 1Q21 Order intake in Minsait down -8.2% in local currency, partially affected by the difficult comparison vs the previous year, in which order intake grew by +10.5%, due to the renewals of multi-year relevant contracts. Nevertheless, order intake is expected to accelerate and return to growth in the next quarters.
1Q21 revenues grew +5.5% in local currency (+2.2% in reported terms):
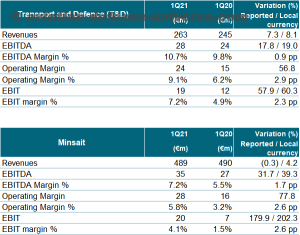
- 1Q21 revenues in the T&D division increased by +8.1% in local currency (+7.3% in reported terms) pushed by the growth registered in Defence & Security (+20.9% in local currency), driven by the higher activity in Spain (multiannual projects of the F110 Frigates and NH90 simulator), AMEA (Air Defence in Azerbaijan and Vietnam) and Europe (higher contribution of the Eurofighter project). Furthermore, it is worth mentioning the growth registered in Transport (+8.4% in local currency), thanks to the milestones certification in the railway transport project in Saudi Arabia and the higher activity in the tolling systems project in the I-66 in USA.
- 1Q21 revenues in Minsait went up +4.2% in local currency and -0.3% in reported terms, mainly pushed by the strong performance in Public Administrations & Healthcare, which grew +20.7% in local currency. Revenues in the rest of the verticals remained at similar levels compared to the previous year (slight growth in local currency in Energy & Industry and Financial Services and slight decrease in Telecom & Media).
FX impact contributed negatively with €-24m in 1Q21, mainly dragged by the Latin-American currencies (Brazilian real and the Mexican and Peruvian peso).
Organic revenues in 1Q21 increased +4.3% (excluding the inorganic contribution of SmartPaper and the FX impact). By divisions, Minsait posted +2.4% organic growth and Transport & Defence recorded +8.1% organic growth in 1Q21.
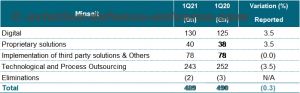
Digital revenues reached €130m (27% of Minsait sales) in 1Q21, which implies +3.5% increase vs 1Q20.
1Q21 reported EBITDA stood at €63m vs €51m in 1Q20, implying +25.1% growth in reported terms.
Operating Margin amounted to €52m in 1Q21 vs €31m in 1Q20 (equivalent to 6.9% operating margin vs 4.2% in 1Q20), due to the improvement in profitability in both divisions, as well as the lower amortization vs last year same period.
- 1Q21 Operating Margin in the T&D division reached €24m vs €15m in 1Q20, equivalent to 9.1% margin vs 6.2% last year same period. The increase in profitability is explained by the sales growth, the action plan efficiency measures, as well as by the better comparison of the Eurofighter project.
- 1Q21 Operating Margin in Minsait stood at €28m vs €16m in 1Q20, equivalent to 5.8% operating margin vs 3.2% in 1Q20. This increase is explained by the the higher level of sales, efficiency measures and savings derived from the action plan, together with the improvement of margins in Energy & Industry and Healthcare
Total workforce restructuring costs which are not part of the action plan amounted to €-7m in 1Q21 vs €-8m in 1Q20.
The impact of FX in EBIT was €-1.9m in 1Q21.
1Q21 reported EBIT was €39m vs €19m in 1Q20, equivalent to 5.2% margin in 1Q21 vs 2.6% in 1Q20.
Net profit of the group stood at €22m vs €6m in 1Q20.
1Q21 Free Cash Flow was €-17m (€-6m excluding the €11m cash out of the workforce transformation plan) vs €-59m last year same period, due to the improvement of the profitability of the operations, the lower working capital consumption and the lower level of Capex compared to 1Q20.
Net Debt amounted to €505m in 1Q21 vs €633m in 1Q20 and €481m in 2020. Net Debt/EBITDA LTM ratio (excluding the impact of IFRS 16, the cost derived from the action plan and the capital gain of Metrocall, which impacted in 2020) stood at 2.4x in March 2021 vs 2.2x in March 2020 and 2.5x in December 2020.
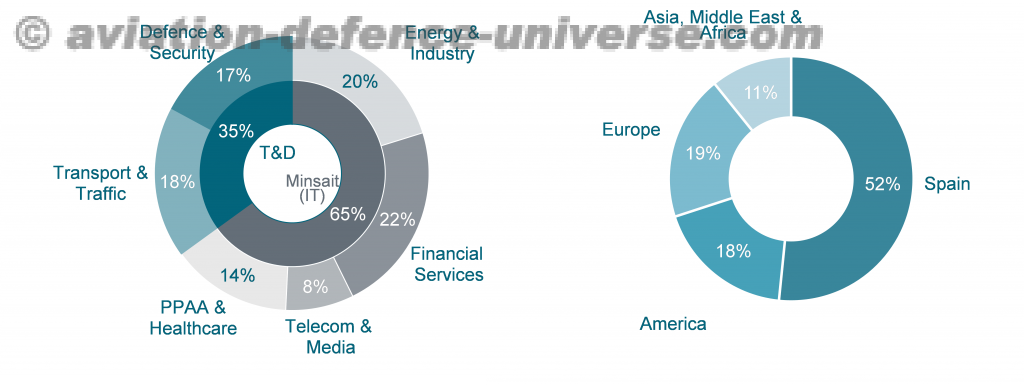
Sales by Verticals and Regions
Outlook 2021
Revenues 2021: > €3,200m in local currency.
EBIT reported 2021: > €200m.
FCF 2021: > €120m (excluding the cash outflows of the workforce transformation plans).
Human Resources
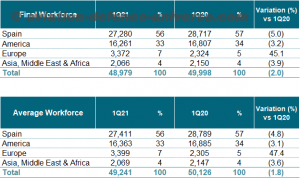
At the end of March 2021, total workforce amounted to 48,979 professionals implying a decrease of -2.0% vs March 2020 (1,019 less employees and despite the SmartPaper acquisition, which initially had 1,047 employees). Total workforce at the end of March 2021 remained almost stable (48 less employees) compared to the end of December 2020 (49,027 employees including the SmartPaper workforce). For its part, 1Q21 average headcount decreased -2% vs 1Q20.
Analysis by Division
Transport & Defence (T&D)
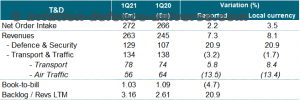
Transport & Defence revenues in 1Q21 went up +8% in local currency, pushed by the growth registered in Defence & Security (+21% in local currency). On the contrary, sales in Transport & Traffic went down -2% in local currency.
Order intake in 1Q21 increased +3% in local currency, pushed by the strong order intake registered in Defence & Security (+28% in local currency).
Backlog/Revenues LTM ratio continued to grow and stood at 3.16x vs 2.61x in 1Q20. Book-to-bill ratio was 1.03x vs 1.09x in 1Q20.
Minsait
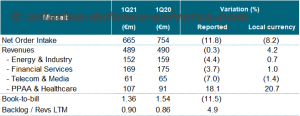
1Q21 Minsait sales up +4.2% in local currency, mainly bolstered by PPAA & Healthcare (+21% in local currency). Regarding the rest of the verticals, sales have remained at similar levels compared to the previous year (slight growth in Energy & Industry and Financial Services and slight decrease in Telecom & Media).
Excluding the inorganic contribution of SmartPaper (BPO Company based in Italy, acquired on December 31st, 2020) and the FX impact, Minsait sales in 1Q21 would have grown +2.4%.
Digital sales amounted to €130m (which represents 27% of Minsait sales) in 1Q21, implying an increase of +3.5% vs 1Q20.
1Q21 order intake in Minsait down -8% in local currency with all the verticals registering declines except for Energy & Industry. Backlog/Revenues LTM improved to 0.90x vs 0.86x in 1Q20. Book-to-bill ratio slightly declined and stood at 1.36x vs 1.54x in 1Q20.
Analysis by Region
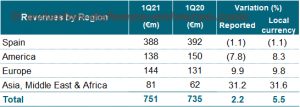
By geographies, it is worth mentioning the growth registered in 1Q21 in AMEA (+32% in local currency; 11% of total sales), Europe (+10% in local currency; 19% of total sales) and America (+8% in local currency; 18% of total sales). On the contrary, sales in Spain slightly decreased (-1%; 52% of total sales).
1Q21 Order intake showed declines in Spain (-7%) and America (-25% in local currency), while Europe and AMEA grew (+18% and +41% in local currency respectively).in America (+4% in local currency). However, AMEA registered strong declines (-25% in local currency).
Appendices:
Consolidated Income Statement
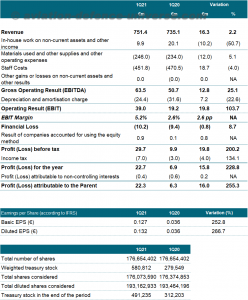
Figures not audited
Basic EPS is calculated by dividing net profit by the average number of outstanding shares during the period less the average treasury shares of the period.
Diluted EPS is calculated by dividing net profit (adjusted by the impact of the €250m convertible bond issued in October 2016 with a conversion price of €14.629), by the average number of outstanding shares during the period less the average treasury shares of the period and adding the theoretical new shares to be issued once assuming full conversion of the bonds.
The average number of shares used in the calculation of the EPS and dilutive EPS for treasury shares, total number of shares and theoretical shares to be issued related to the convertible bonds, are calculated using daily balances.
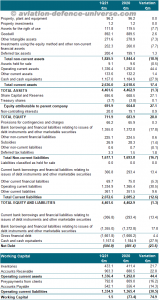
Consolidated Balance Sheet
Consolidated Cash Flow statement
Figures not audited
- The IFRS 16 effect is included in “other financial liabilities variation”
Alternative Performance Measures (APMS)
Due to the application of the Alternative Performance Measures (APM) published by the European Securities and Markets Authority (EMSA), Management of the Group considers that certain APMs provides useful financial information that should be considered to evaluate the performance of the Group by users. Additionally, Management uses these APMs for making financial, operating and strategic decisions, as well as to evaluate the Group performance. It should be noted that the amounts of the APMs have not been subject to any type of audit or review by the auditors of the Company.
Organic Revenues
Definition/Conciliation: Revenues adjusted by foreign exchange impact and perimeter changes of consolidation (acquisitions and divestments). Foreign exchange impact is adjusted by calculating the revenues with the average forex of the previous period. Perimeter changes are adjusted taken into account the acquisitions as if they had been consolidated in the previous period.
Explanation: Metric that reflects the revenue growth excluding the impacts coming from the perimeter changes (acquisitions and divestments) and the foreign exchange.
Coherence in the criteria applied: There is no change in the criteria applied compared to last year.
Operating Result (EBIT):
Definition/Conciliation: It is defined in the consolidated income statement.
Explanation: Metric that the Group uses to define its operating profitability and widely used by investors when evaluating businesses.
Likewise, the Group uses it as an indicator of the performance of the EBIT margin, which is the result of the ratio between EBIT and the amount of sales for the same period. This indicator is explained as the operating profit of the Group for each euro of sales.
Coherence in the criteria applied: There is no change in the criteria applied compared to last year.
Operating Margin
Definition/Conciliation: Represents the Operating Result (EBIT) plus staff reorganization costs, impairments, integration and acquisition costs, amortization of intangible assets from acquisitions, equity based compensation and possible fines.
Explanation: Metric that the Group uses to define its operating profitability before certain extraordinary costs and widely used by investors when evaluating Information Technology businesses.
Likewise, the Group uses it as an indicator of the performance of the Operating Margin (%) that is the result of the ratio between Operating Margin and the amount of sales for the same period.
Coherence in the criteria applied: There is no change in the criteria applied compared to last year.
Gross Operating Result (EBITDA):
Definition/Conciliation: It is calculated by adding the Depreciations and Amortizations to the “Operating Result (EBIT)” as indicated in the consolidated income statement
Explanation: Metric that the Group uses to define its operating profitability, and widely used by investors when evaluating businesses.
Likewise, the Group uses it as an indicator of the performance of the EBITDA margin, which is the result of the ratio between EBITDA and the amount of sales for the same period. This indicator is explained as the operating profit of the Group plus Depreciations and Amortizations for each euro of sales.
Coherence in the criteria applied: There is no change in the criteria applied compared to last year.
Net Financial Debt:
Definition/Conciliation: Represents Non-current Loans and Borrowings and Current Loans and Borrowings less Cash and Cash equivalents. Net Financial Debt is obtained by subtracting the balances corresponding to the headings of the Consolidated Balance Sheet, “Long and Current borrowings with Credit Institutions” and “Financial Liabilities for Issuance of Non-current and Other Marketable Securities”, the amount of the heading “Cash and cash equivalents”.
Explanation: Financial proxy that the Group uses to measure its leverage.
Likewise, the Group uses the ratio Net Financial Debt over EBITDA as an indicator of its leverage and repayment capacity of its financial debt. For that reason, the figure used to calculate the ratio for intermediate periods is made by taking into consideration the equivalent last twelve months EBITDA immediately preceding the calculation date of the ratio.
Coherence in the criteria applied: There is no change in the criteria applied compared to last year.
Free Cash Flow:
Definition/Conciliation: These are the funds generated by the Company excluding dividend payment, net financial investments/divestments and others, and the investment in treasury stock. It is calculated starting from “Profit Before Tax” as indicated in the consolidated statement of cash flows; adding depreciation and amortization, deducting provisions, capital grants and others, adding result of companies accounted for using the equity method, adding financial losses, adding dividend received, adding cash flow from operating activities, deducting capex, deducting interest paid and received and deducting income tax paid.
Explanation: It is the treasury made by the operations of the Group that is available to providers (shareholders and financial creditors) once the investment needs of the Group are already satisfied. It is an indicator used by investors when evaluating businesses.
Coherence in the criteria applied: There is no change in the criteria applied compared to last year.
Contribution Margin:
Definition/Conciliation: It is the difference between revenues and direct and indirect costs of the segments or businesses of the Group. Direct costs are those directly attributable to the sales recognized in a specific period of time and include the cost of the headcount or subcontractors used in the projects as well as any incurred costs related to the development and completion of the project; such as material costs, travel expenses of the project, among others. Indirect costs are those which, although are linked to a segment or businesses of the Group, are not directly attributable to billable projects or to revenues accounted for a specific period of time; such as, commercial costs, cost of making offers, the cost of management of a specific segment, among others. Contribution margin does not include overheads as these costs are not directly attributable to a particular segment or business.
Explanation: contribution margin measures the operating profitability of a segment or business of the Group excluding overheads, as these costs are not directly attributable to a particular segment or business.
Likewise, in order to ease the comparison between segments with different relative weight over the total revenues of the Group, it is used the contribution margin ratio over revenues of a segment or business. This indicator is explained as the contribution margin for each euro of sales of a specific segment.
Coherence in the criteria applied: There is no change in the criteria applied compared to last year.
Order Intake:
Definition/Conciliation: It is the amount of contracts won over a period of time. Order intake cannot be confused with revenues or the net amount of sales because the amount of a contract won in a specific period of time (and that computes as Order Intake in that period of time) can be executed over several years.
Explanation: Order intake is an indicator of the future performance of the Group because it is the amount of the contracts won over a period of time.
Coherence in the criteria applied: There is no change in the criteria applied compared to last year.
Backlog:
Definition/Conciliation: It is the amount of accumulated order intake less revenues executed, plus/minus forex adjustments and the renegotiation of the contracts, among others. It is the pending revenues figure until the completion of the project to complete the order intake figure.
Explanation: Backlog is an indicator of the future performance of the Group because it is the amount of the contracts won still to be executed.
Coherence in the criteria applied: There is no change in the criteria applied compared to last year.
Glossary
AMEA: Asia, Middle East and Africa.
ATM: Air Traffic Management.
BPO: Business Process Outsourcing.
Book-to-Bill: Order intake/Revenues ratio.
CAPEX: Capital Expenditure.
DGT: Dirección General de Tráfico.
DoS: Days of Sales.
EBITDA: Earnings Before Interests, Taxes, Depreciations and Amortizations.
EBIT: Earnings Before Interests and Taxes.
EPS: Earnings Per Share.
IT: Information Technology
LTM: Last Twelve Months.
MoD: Ministry of Defence.
R&D: Research & Development.
T&D: Transport & Defence.